Introducing the AlphaSOC Cribl Dashboard
The AlphaSOC for Cribl Search pack brings OCSF detection findings into a purpose-built dashboard for triage, entity analysis, and raw event inspection.

When a SOC analyst opens their tooling in the morning, the first question is always the same: where do I start? Without a clear entry point, that question costs time: pivoting between tools, rebuilding context, and sometimes missing the escalation that needed to happen an hour earlier. AlphaSOC generates OCSF detection findings across cloud, application, network, and endpoint telemetry. The AlphaSOC for Cribl Search pack puts those findings into a structured dashboard where you can answer that question without writing a query. Filter by severity, pivot to affected entities, inspect observables, and drill into raw events from a single view.
What the Pack Provides
The pack ships with a single dashboard built on top of AlphaSOC's OCSF Detection Finding schema. It is available at packs.cribl.io and installs through the standard Cribl pack process.
The dashboard ships with a built-in demo dataset (AlphaSOC_Demo) that loads automatically on first open. Everything in the triage walkthrough below is visible against that dataset before you connect a single live source.x
Summary Counters and Timeline
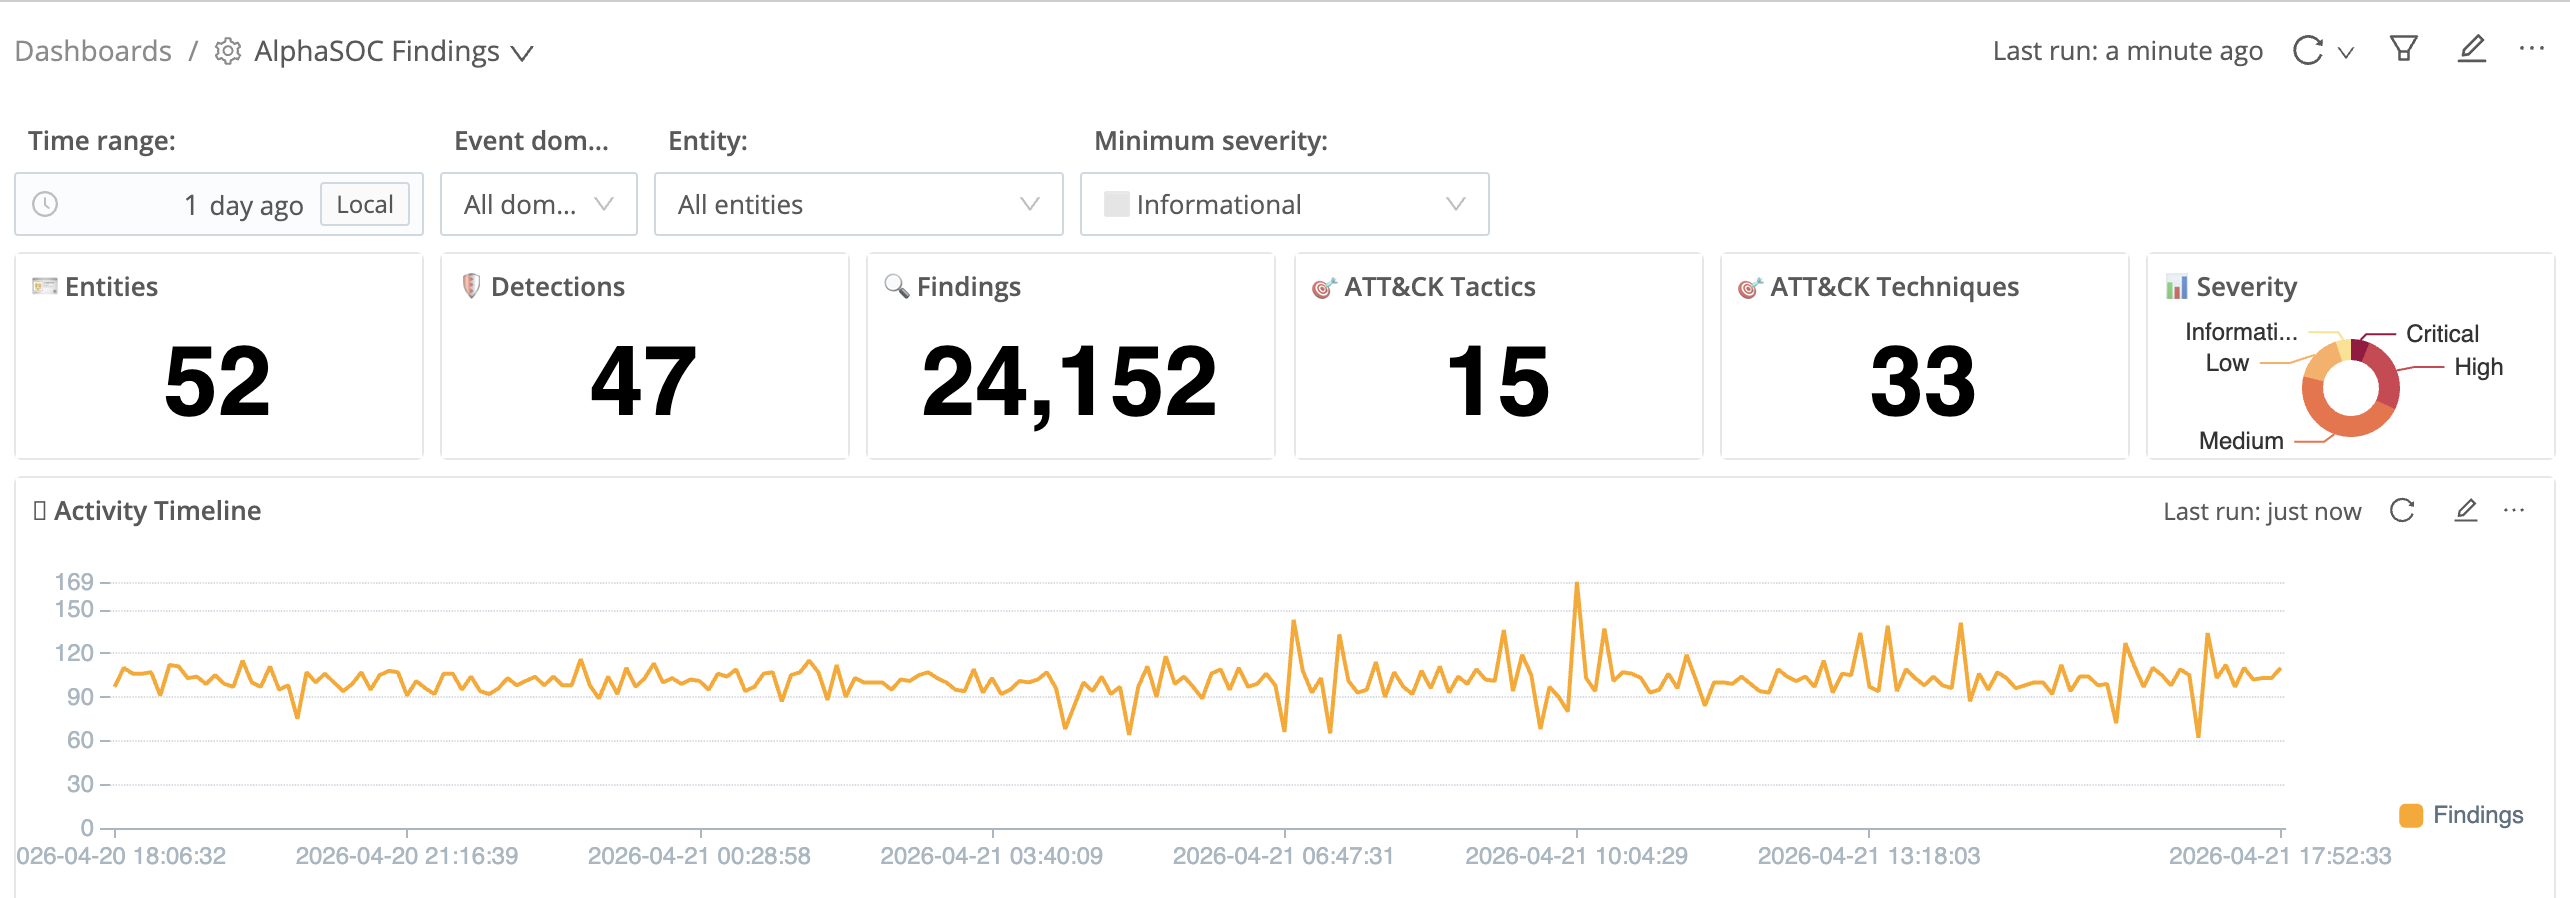
Five counters sit at the top of the dashboard: Entities, Detections, Findings, ATT&CK Tactics, and ATT&CK Techniques. These give you an immediate read on the scope of activity before you drill into anything. In the view above, 52 entities generated 24,152 findings across 15 ATT&CK tactics and 33 techniques in a single 24-hour window. That spread across 15 tactics tells you this is not a single-vector incident: Command and Control, Impact, Persistence, Privilege Escalation, and more are all represented.
The Severity donut chart sits alongside the counters. At a glance it shows the balance between Critical, High, Medium, Low, and Informational findings. A majority slice of Critical and High means your triage queue is heavy; a majority of Informational means you are looking at routine noise with a smaller high-confidence signal underneath.
The Activity Timeline below the counters plots finding volume over time. The view above shows a broadly consistent baseline across the 24-hour window, with a notable spike approaching the right edge. A sharp increase that was not present in the hours before it is the signal to prioritise before anything else. Correlating that spike against known deployment windows or maintenance schedules is often enough to either explain it or confirm it warrants investigation.
Findings Table
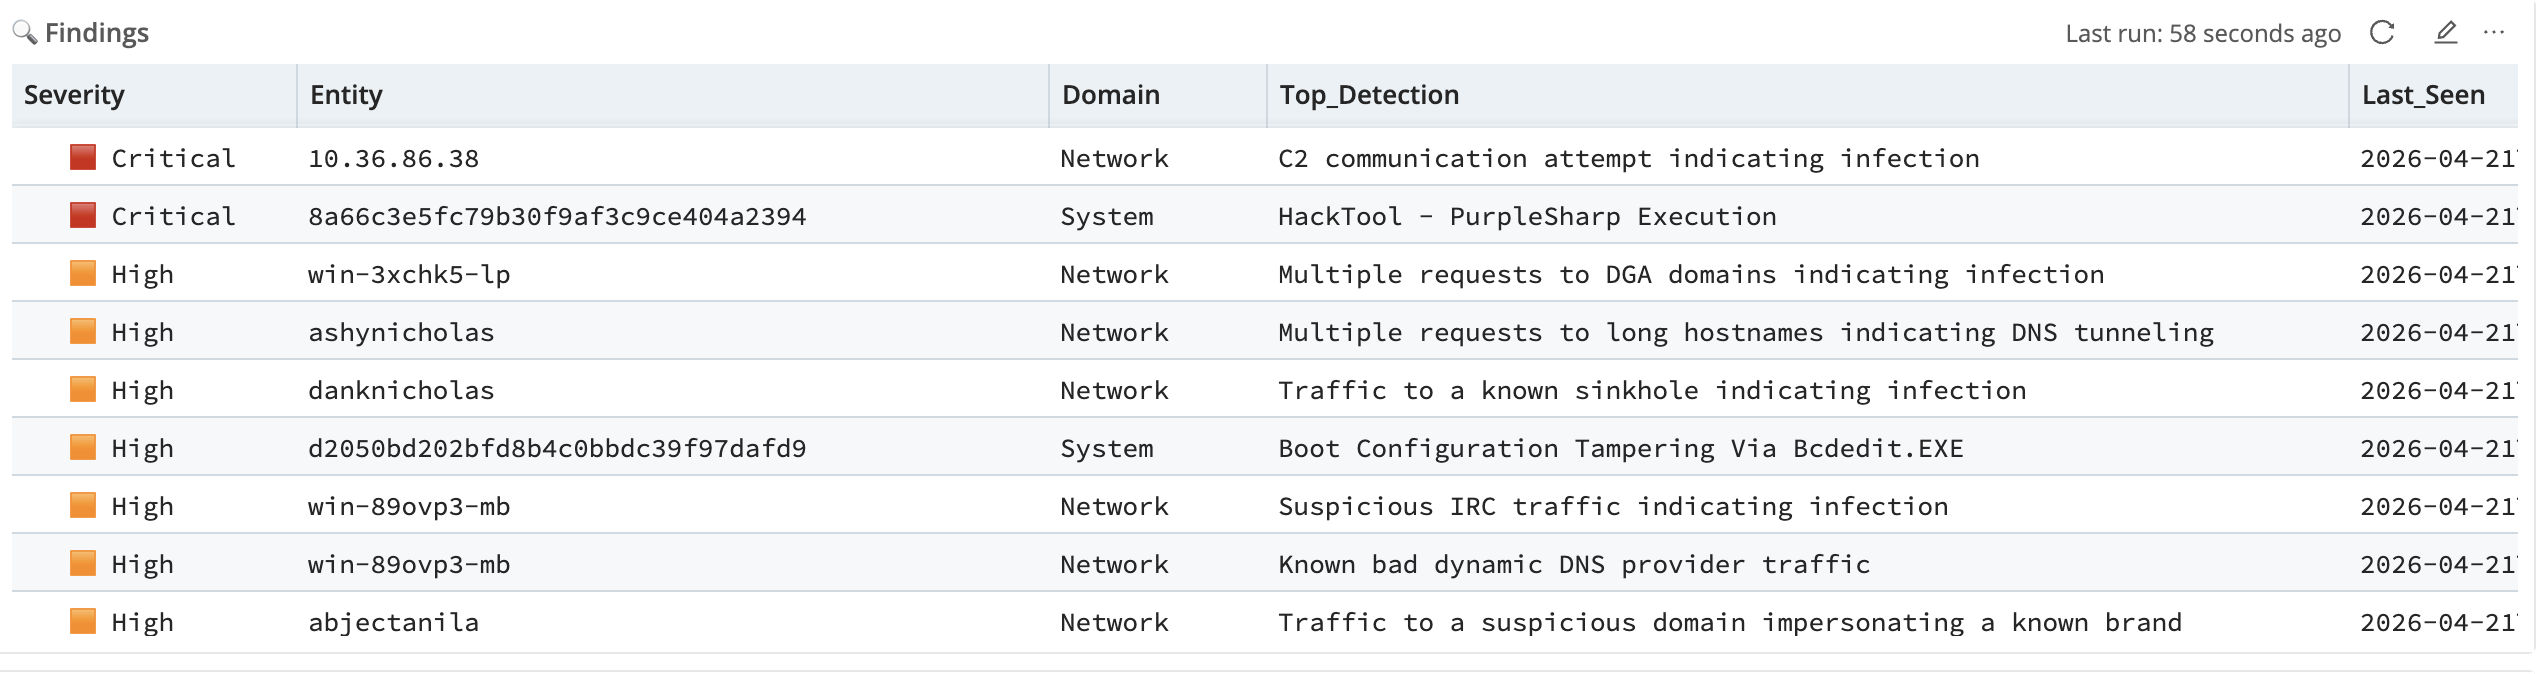
The Findings table is the primary triage surface. Each row represents a unique combination of severity, entity, event domain, and top detection rule. Sort by severity, then by finding count, and the top rows become your investigation queue.
In the view above, 10.36.86.38 sits at Critical with "C2 communication attempt indicating infection" as its top detection. That is your first stop. Directly below it, 8a66c3e5fc79b30f9af3c9ce404a2394 also appears at Critical with "HackTool - PurpleSharp Execution." The hash-format entity name signals a container, ephemeral workload, or managed device rather than a named host. PurpleSharp is an adversary simulation tool: its presence on a production host at Critical severity is not ambiguous.
Further down, win-3xchk5-lp appears at High with 16,568 findings and "Multiple requests to DGA domains indicating infection" as its top detection. Domain Generation Algorithm traffic at that volume, sustained across a 24-hour window, is consistent with an active C2 channel. ashynicholas follows at High with 7,928 findings for "Multiple requests to long hostnames indicating DNS tunneling." Two entities, two distinct covert channel techniques, both active in the same window.
Observables Table
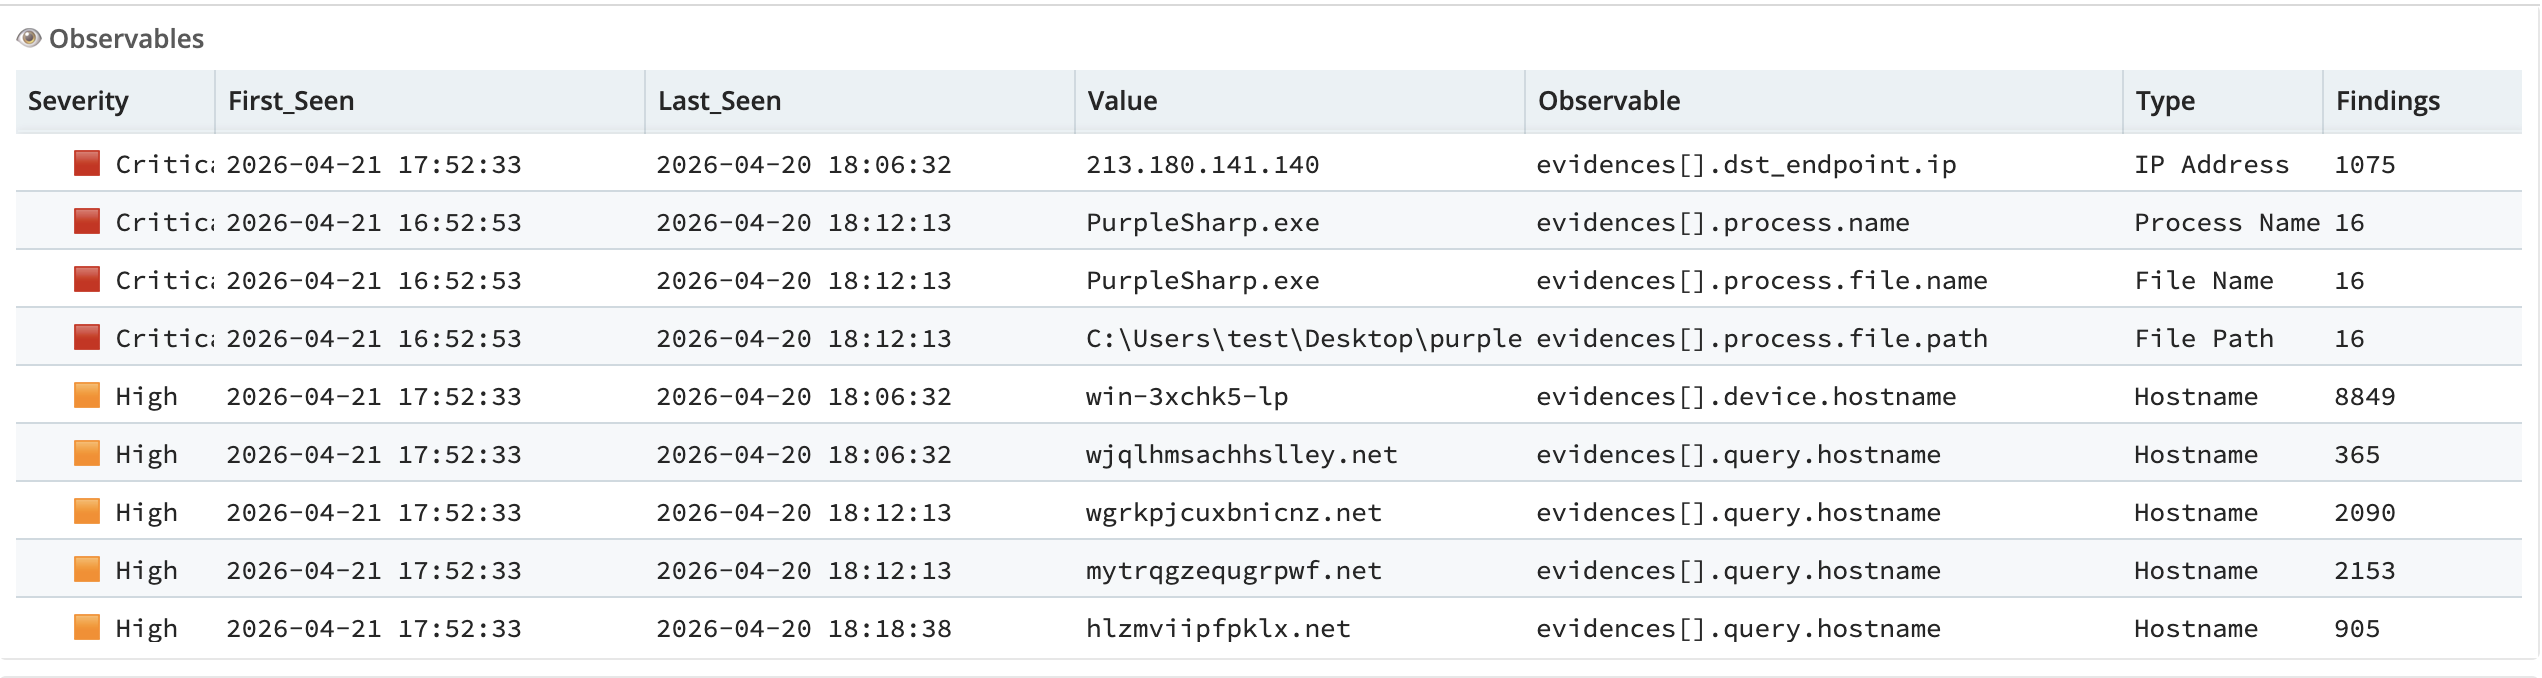
The Observables table extracts every indicator from the underlying OCSF detection findings: IP addresses, domains, hostnames, process names, file paths, and other artifacts. Each row shows the observable type, its value, the severity of the finding it came from, and the time window in which it was seen.
This is where you pivot from an entity to the specific infrastructure or tooling involved. In the view above, the Critical IP 213.180.141.140 appears across 1,075 findings as a destination endpoint. That volume at Critical severity makes it the first external indicator to submit to threat intelligence or block at the perimeter.
Directly below it, PurpleSharp.exe appears as both a process name and a file name at Critical severity, alongside the full file path C:\Users\test\Desktop\purple.... This is the concrete evidence behind the hash-format entity's detection in the Findings table: an adversary simulation binary running on a production host. The file path tells you exactly where it was executed.
The High severity rows show a cluster of algorithmically generated hostnames: wjqlhmsachlley.net, wgrkpjcuxbnicnz.net, mytrqgzequgrpwf.net, hlzmviipfpklx.net. These are DGA domains associated with win-3xchk5-lp. The random-looking character strings are a signature pattern of DGA-based C2 communication. Take this cluster to your threat intelligence platform or DNS block list.
Detections Table
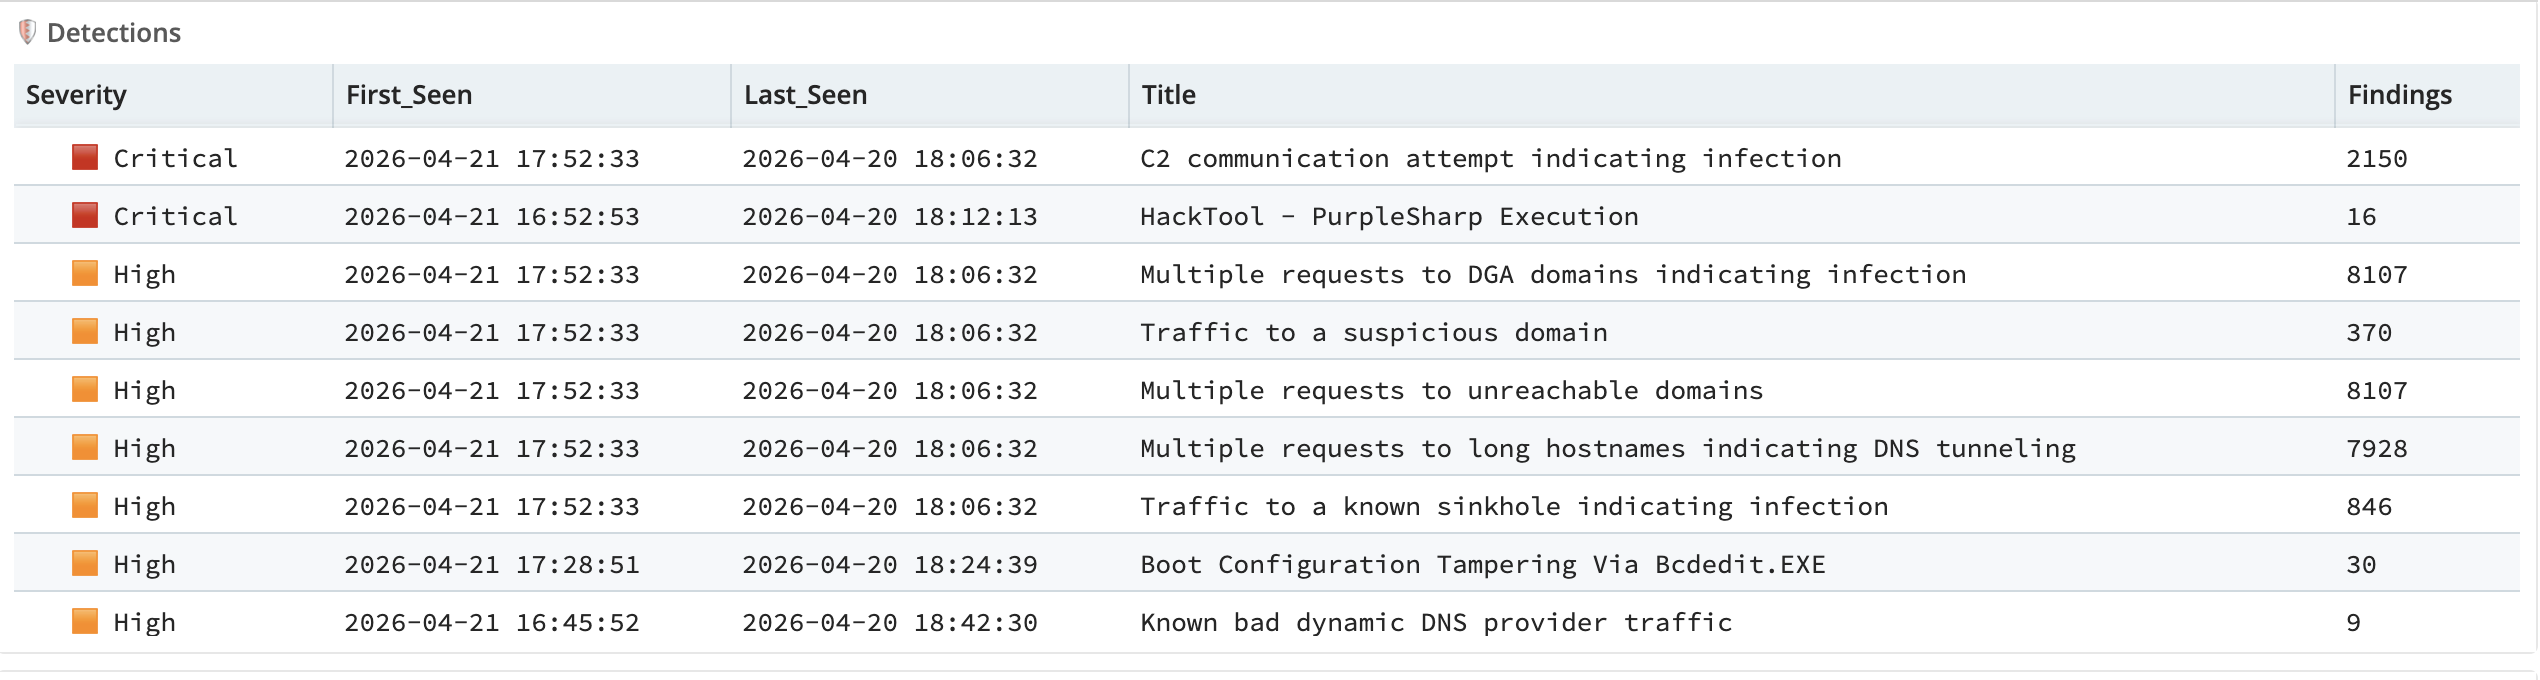
The Detections table lists every rule that fired, with severity, the time range of activity, and the finding count. This view answers two questions: which rules are generating the most signal, and has any rule fired for the first time recently.
In the view above, the two Critical rules are "C2 communication attempt indicating infection" (2,150 findings) and "HackTool - PurpleSharp Execution" (16 findings). The volume difference is significant: the C2 rule firing 2,150 times represents persistent outbound communication to a known-bad destination. The PurpleSharp rule firing 16 times represents a targeted execution event. Both are Critical, but they call for different responses.
The High severity rules tell a coherent story beneath the Critical findings: "Multiple requests to DGA domains indicating infection" (8,107 findings), "Multiple requests to long hostnames indicating DNS tunneling" (7,928 findings), and "Traffic to a known sinkhole indicating infection" (846 findings) all point to the same underlying picture of compromised endpoints actively communicating over covert channels. "Boot Configuration Tampering Via Bcdedit.EXE" (30 findings) is a separate thread: ransomware precursor activity on a System domain entity.
A new detection appearing in your environment for the first time warrants closer inspection regardless of volume. Novelty is its own signal.
Entities Table
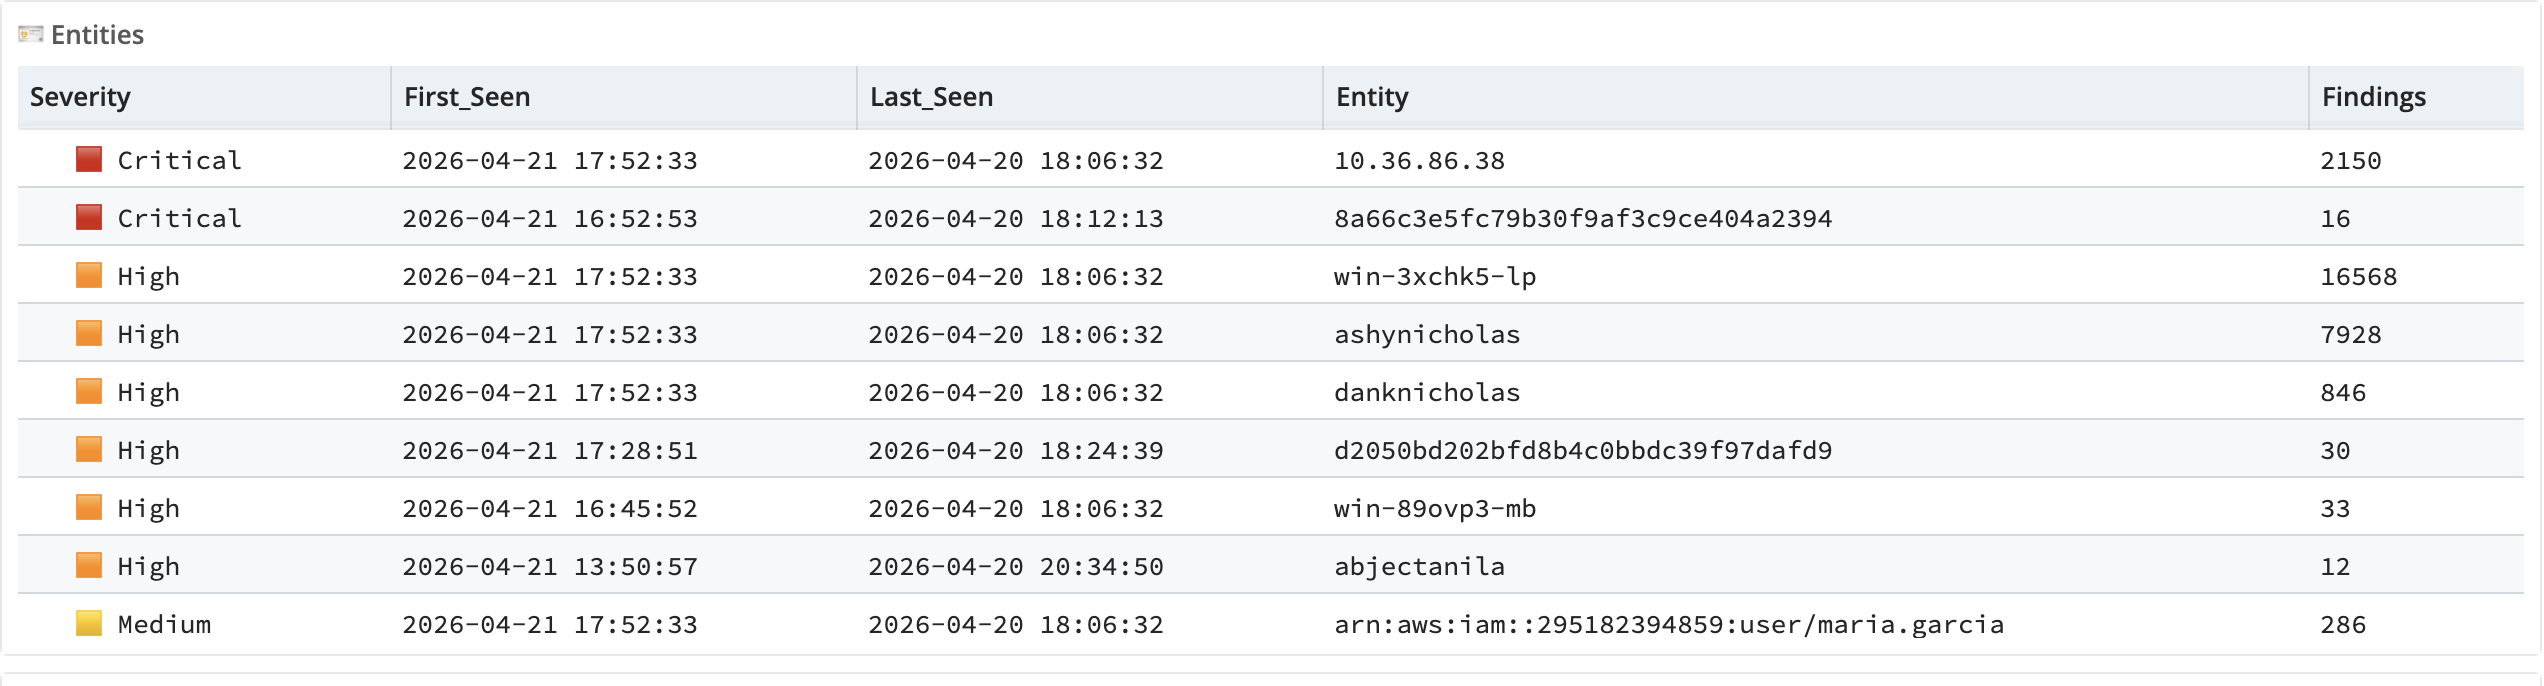
The Entities table shows which users and devices appear most frequently across findings, ranked by severity and finding count. An entity triggering multiple detection rules at Critical severity is a higher-priority investigation target than one that fired a single Low-severity rule once.
In the view above, 10.36.86.38 leads at Critical with 2,150 findings spanning the full 24-hour window, first seen 2026-04-21 and last seen 2026-04-20 (the dataset covers a rolling window). Below it, the hash-format entity 8a66c3e5fc79b30f9af3c9ce404a2394 appears at Critical with 16 findings: precise, targeted, and consistent with a simulation tool run against a managed workload.
win-3xchk5-lp and ashynicholas both appear at High with 16,568 and 7,928 findings respectively. These are your highest-volume High-severity entities, both active for the full window. danknicholas follows at High with 846 findings for sinkhole traffic. The pattern of ashynicholas and danknicholas appearing together, both at High, both in the Network domain, is worth cross-referencing in the Detections table: similar names, similar timing, different techniques can indicate either coordinated activity or a shared infrastructure problem.
At the bottom of the visible rows, arn:aws:iam::295182394859:user/maria.garcia appears at Medium with 286 findings in the Application domain. An AWS IAM identity in an ARN format tells you this is cloud telemetry. Medium severity with 286 findings warrants a look at the Observables table to see what specific actions or destinations are associated with that identity.
Raw Events
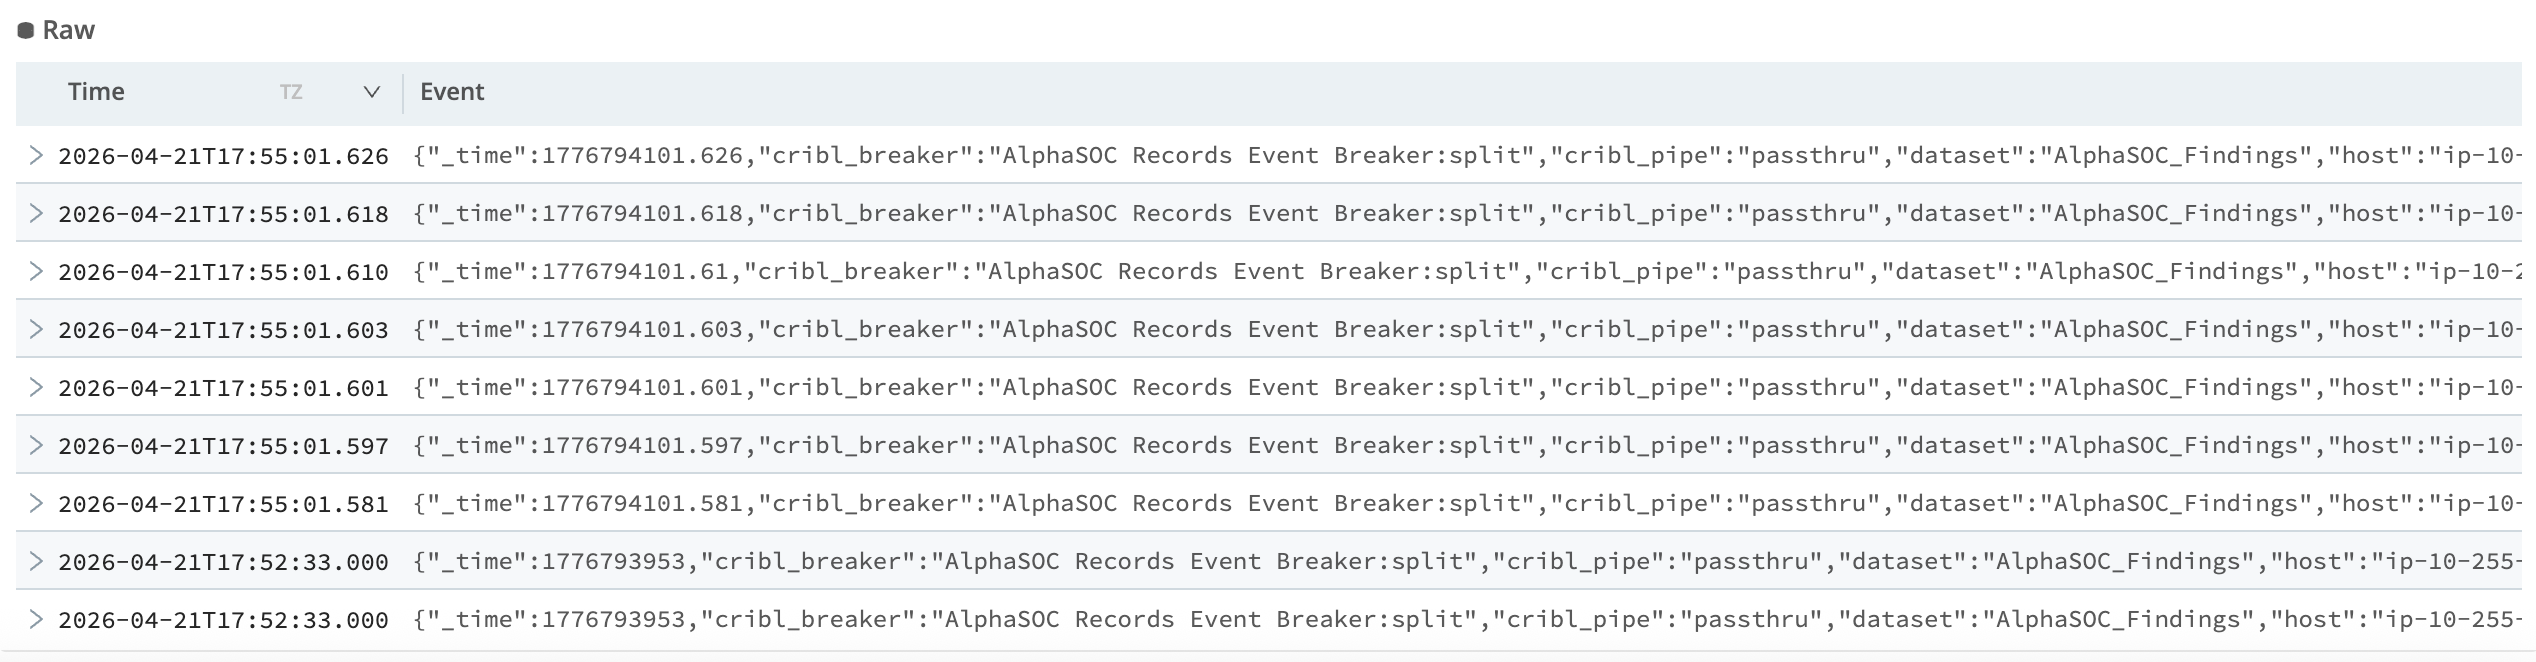
The Raw panel exposes the underlying OCSF detection finding events. Each row is a complete finding event in AlphaSOC's OCSF format, including the detection rule that fired, the MITRE ATT&CK tactic and technique, the evidence records, the source and destination endpoints, and the timestamps.
The view above shows the raw event stream from the AlphaSOC_Findings dataset. Expanding any row gives you the full JSON structure. For the C2 finding on 10.36.86.38, the raw event includes the destination IP, port, protocol, bytes transferred, and packet counts: enough to characterise whether the traffic is periodic beaconing or a sustained data transfer. If you need to copy an event into another tool, run it through a SOAR playbook, or verify a specific field value that the structured tables do not surface, this is where you go.
Dashboard Filters
Four inputs at the top of the dashboard control the scope of every panel simultaneously:
- Time range - standard relative or absolute time picker
- Event domain - filter to Application, Identity, Network, System, or all domains
- Entity - filter to a specific user or device; the list is populated dynamically from your data
- Minimum severity - set a floor to suppress lower-severity noise during focused investigations
Changes to any filter propagate to all panels instantly. Set the domain to Network and the minimum severity to High, and every panel updates to show only network findings at High severity or above. This scopes an investigation to a specific domain and severity floor without writing a query.
A Typical Triage Workflow
Walking through the dashboard from first open:
-
Check the summary counters. The finding count and ATT&CK tactic spread tell you whether you are dealing with a broad incident or a focused one before you look at a single entity. Fifteen tactics in scope means multiple attack phases are represented. Set your time range to cover the full available window before filtering anything down.
-
Scan the Activity Timeline for spikes. A sharp increase in the early hours, outside any known maintenance or deployment window, is worth pulling on first. The baseline tells you what normal looks like; deviations from it are where investigation starts.
-
Sort the Findings table by severity, then by finding count. The Critical rows are your lead. Pay attention to the distinction between high-volume Critical findings (sustained activity over time) and low-volume Critical findings (a single precise detection). Both are urgent, but they point to different investigation paths.
-
Switch to the Detections table to understand what each entity's findings are actually composed of. An entity appearing at High with thousands of findings may be dominated by a single noisy rule, or it may represent a genuine spread across multiple detection categories. The Detections table tells you which.
-
Open the Observables table and filter to Critical and High severity. External IP addresses, suspicious hostnames, and process names at Critical severity are the indicators to take to threat intelligence or hand to your SOAR. Look specifically for process names: a known attack tool appearing as an observable confirms the detection is not a false positive.
-
For any finding that needs closer inspection, drop into Raw events. The full OCSF structure is there: the detection rule, the tactic and technique IDs, the evidence records, and the timestamps.
Getting Started
Prerequisites
Before installing the pack, confirm the following:
- Cribl Search is running (cloud or on-premise). The dashboard is a Cribl Search artifact and requires access to the Cribl Search UI.
- AlphaSOC OCSF detection findings are flowing into a Cribl Lake dataset. See the Cribl Stream integration guide for setup.
- You have pack installation permissions in your Cribl environment. This is a standard Cribl permission; confirm with your Cribl administrator if unsure.
If you do not yet have findings in a Lake dataset, the AlphaSOC_Demo dataset loads automatically on first open. The triage workflow above is fully navigable against that demo data before you connect any live source.
Install the pack
Navigate to the Cribl Packs Dispensary and search for AlphaSOC, or go directly to packs.cribl.io/packs/cc-search-alphasoc. Install using the standard pack process.
Connect your dataset
By default, the dashboard renders the AlphaSOC_Demo dataset. To switch to your live findings:
- Open the dashboard and locate the Dataset dropdown in the filter bar.
- Click the Edit (pencil) icon on the dataset input.
- In the Values section, click Add value and enter the name of your Cribl Lake dataset containing AlphaSOC OCSF detection findings.
- Check Default to make your dataset load automatically on each dashboard open.
- Click Save and Exit.
The dataset must contain raw OCSF Detection Finding events in AlphaSOC format. If your findings are arriving via the AlphaSOC REST Collector configured in Cribl Stream and routed to Lake, they are already in the correct format.
Verify the connection
After switching to your dataset, check the five summary counters at the top of the dashboard. If Entities, Detections, and Findings all show non-zero values for your chosen time range, the dashboard is reading your data correctly. If the counters show zero, confirm the time range covers a period when AlphaSOC was actively generating findings and verify the dataset name matches exactly.
Streamlined Setup Coming to Cribl Stream
The current setup path requires manual MinIO destination configuration in Cribl Stream (the object storage layer that routes findings to Cribl Lake). The Cribl team is working on an AlphaSOC tile for Cribl Stream that will replace this with a guided setup flow directly within the Cribl UI.
Install the pack, open the demo dataset, and work through the triage workflow above. When you are ready to connect your own environment, the AlphaSOC Cribl integration documentation covers the full setup. For questions or issues, contact support@alphasoc.com.